Drug-Drug Interaction Risk Calculator (DDIRc)
An integrated predictive tool within the PharmaPendium platform.
THE CHALLENGE
How might we help pharmaceutical researchers predict dangerous drug interactions earlier in the development process?
Modern medicine increasingly relies on polypharmacy—particularly among aging populations, with 9% of Americans over 55 taking ten or more medications simultaneously. This complexity creates significant risk of harmful Drug-Drug Interactions (DDIs), which:
- Alter medication efficacy
- Cause dangerous side effects
- Contribute to an estimated 197,000 deaths annually in Europe alone
For pharmaceutical companies, discovering these interactions late in development can lead to costly failures, regulatory issues, and delayed market entry. They needed a tool that could predict these risks reliably, early in the development pipeline.
MY ROLE
As Lead UX Designer for the DDIRc module within the PharmaPendium platform, I owned the end-to-end user experience. With no dedicated UX researcher on the team, I took initiative to lead all research activities, including:
- Leading discovery research to identify user needs and pain points
- Designing the complete user journey from data input to results interpretation
- Creating wireframes, user flows, and interactive prototypes
- Planning and executing Alpha and Beta testing with pharmaceutical partners
- Analyzing research findings and prioritizing design improvements
- Collaborating closely with stakeholders to ensure scientific accuracy while maintaining usability
- Translating complex scientific requirements into intuitive interfaces
THE PROCESS
1. Discovery: Understanding the Scientific Workflow
I began by immersing myself in the complex world of drug interaction assessment, working directly with scientists from our pharmaceutical partners (Sanofi, Merck, Servier, and Boehringer Ingelheim).
Key Activities:
- Led collaborative workshops to map the end-to-end DDI assessment journey
- Conducted contextual interviews with scientists to understand existing workflows
- Analyzed pain points in current processes
- Identified opportunities for streamlining data entry and interpretation
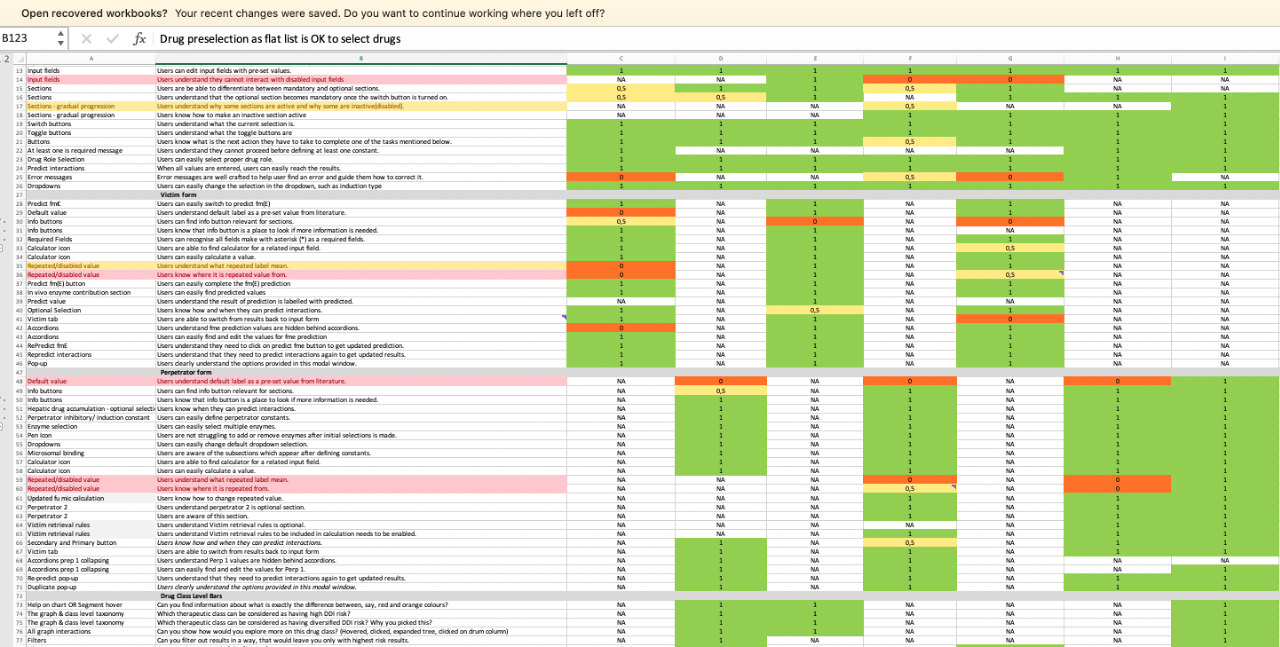
Key Insight: Scientists needed a tool that balanced comprehensive data collection with efficiency—no small challenge given the complex parameters involved in DDI assessment.
2. Concepting: From Data to Decisions
Working with complex scientific parameters required careful consideration of information architecture and workflow design.
Key Activities:
- Created concept maps to organize parameter relationships
- Explored multiple approaches for structuring the user interaction
- Sketched various input models and visualization alternatives
- Tested early concepts with subject matter experts
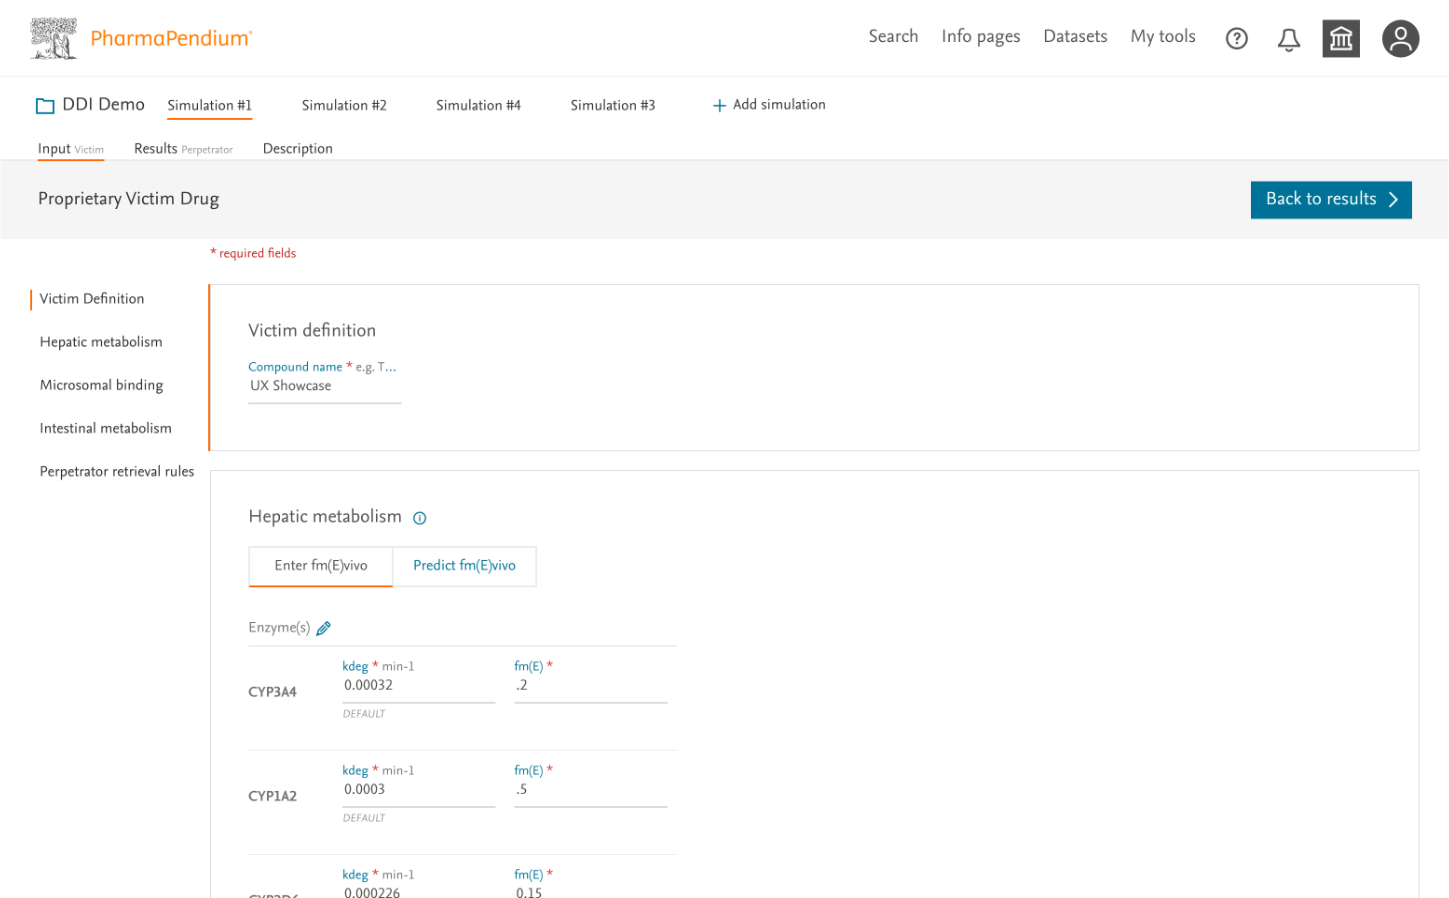
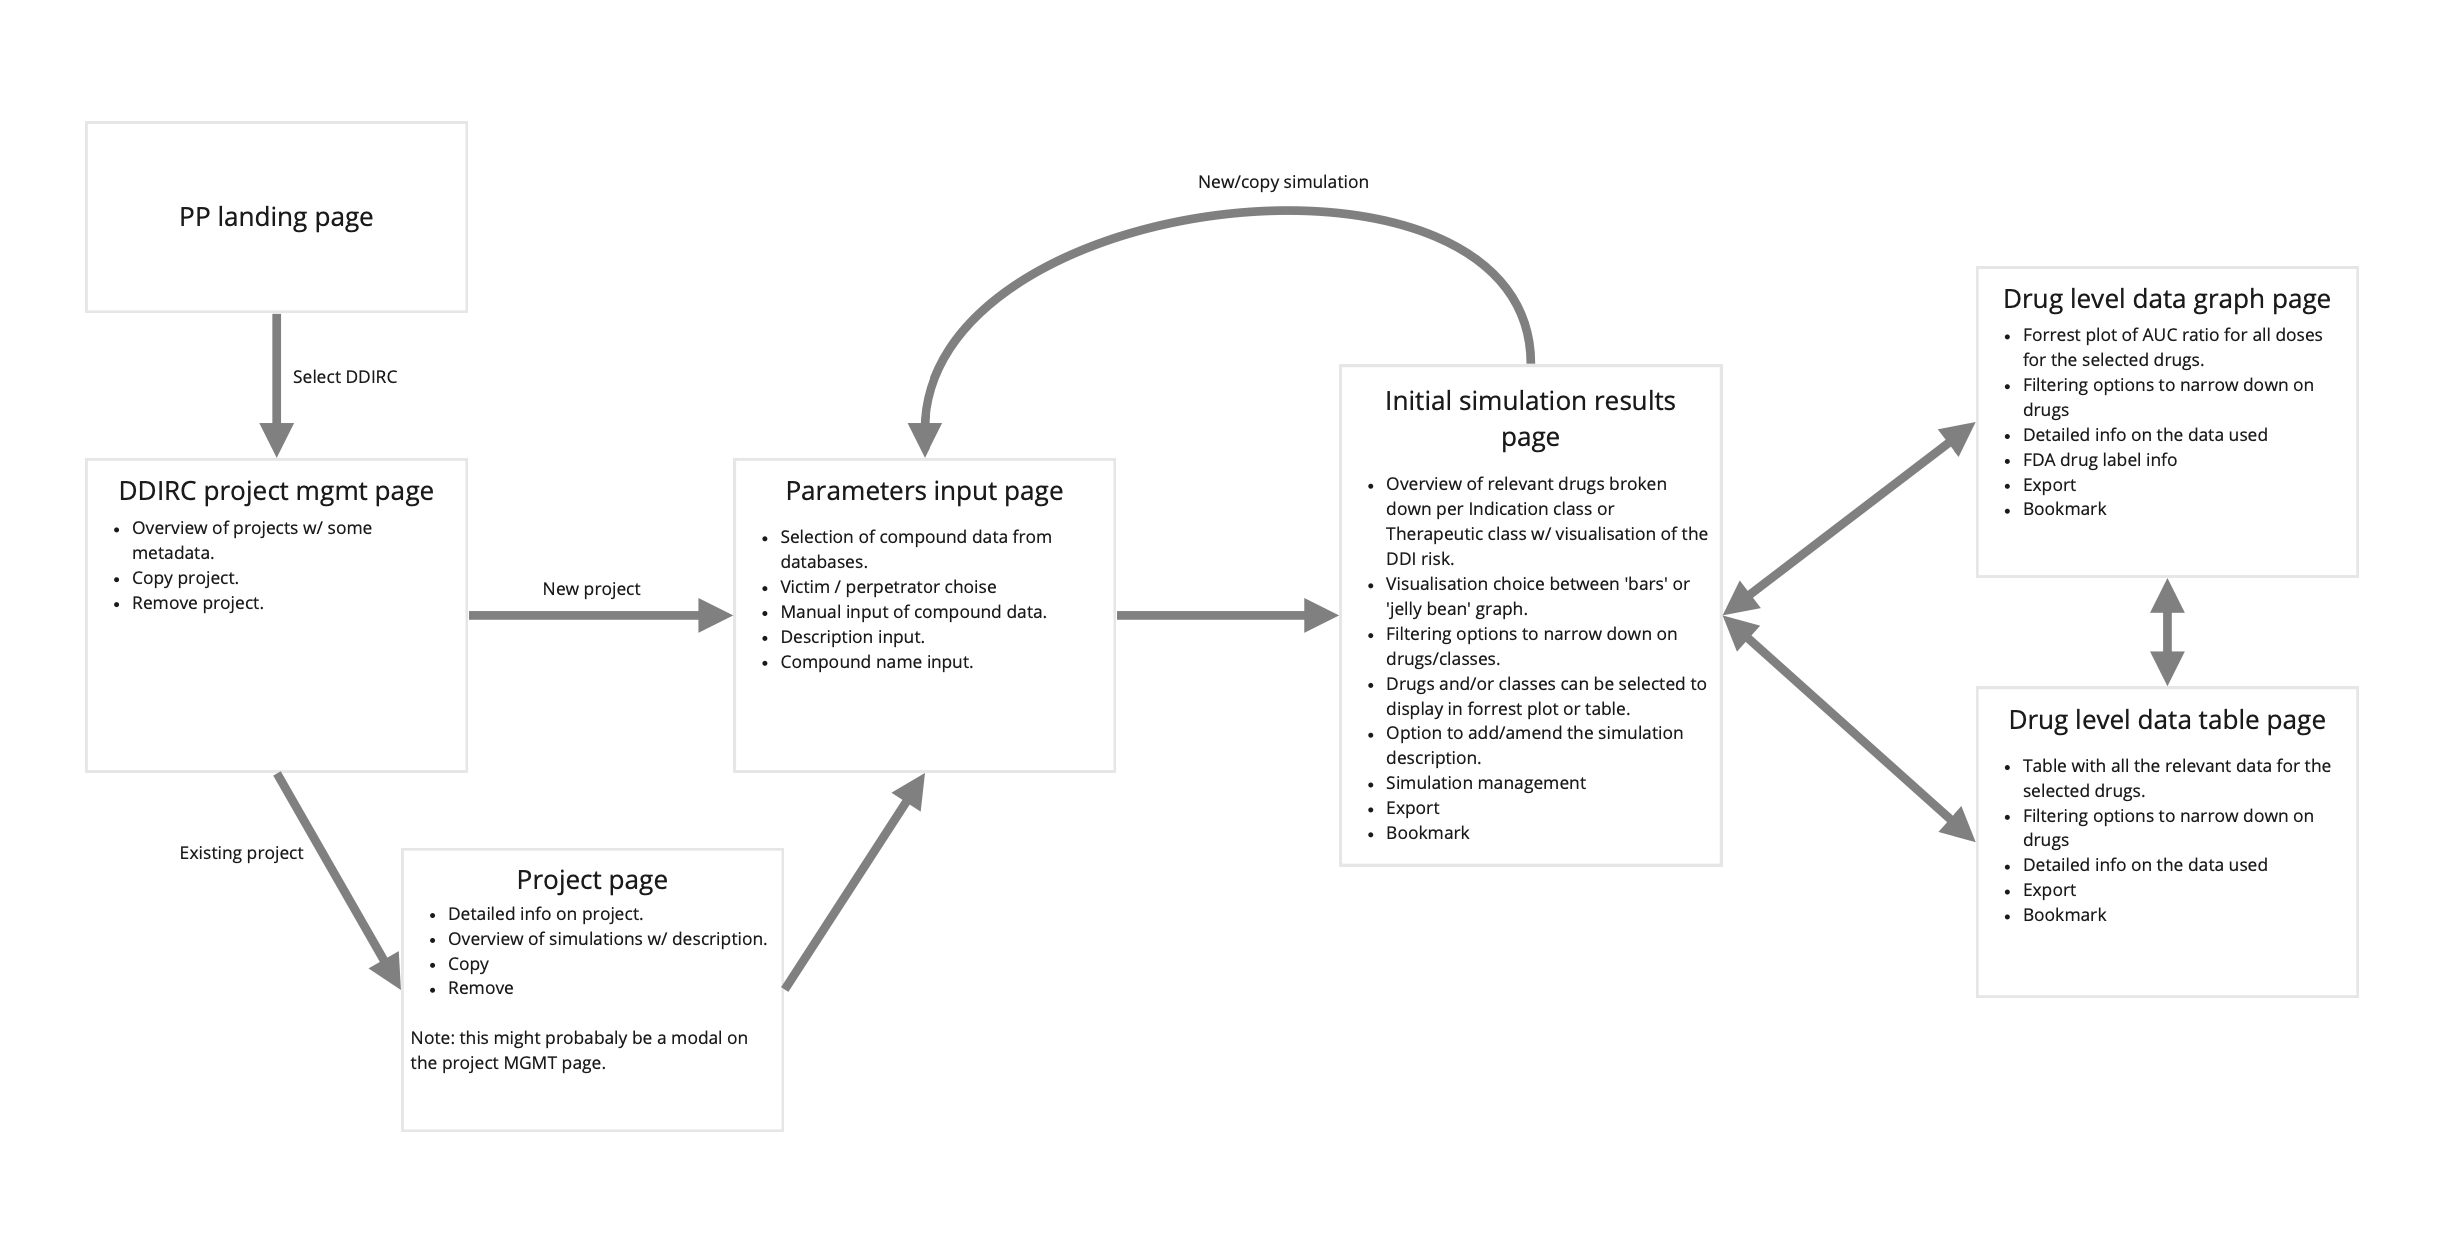
Key Decision: Rather than overwhelming users with all parameters at once, I designed a wizard-based approach that would guide users through logically grouped sections, providing contextual help and defaults where appropriate.
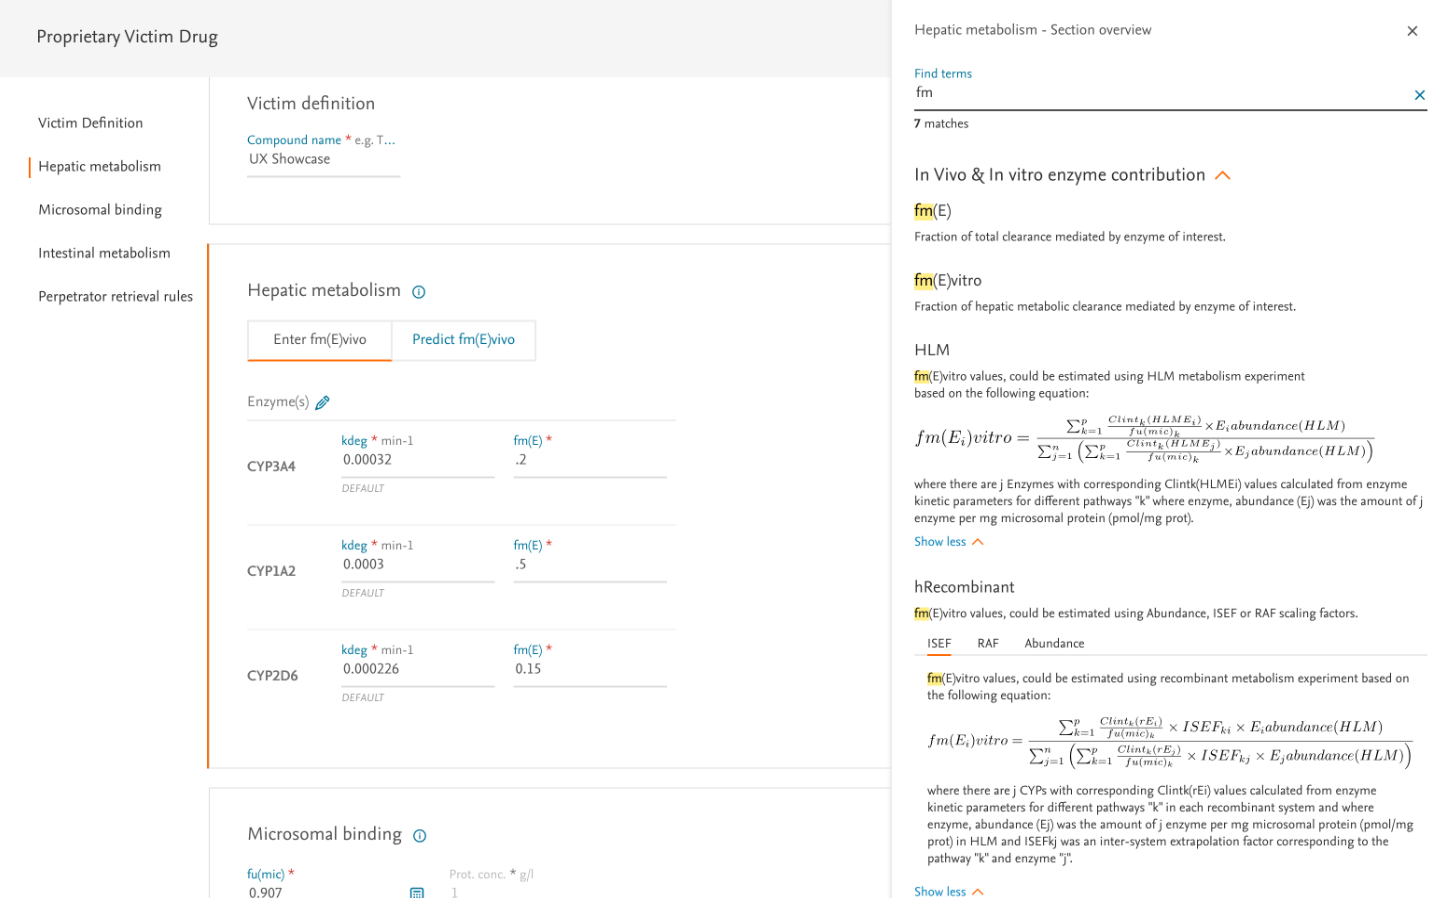
3. Designing the Input Experience
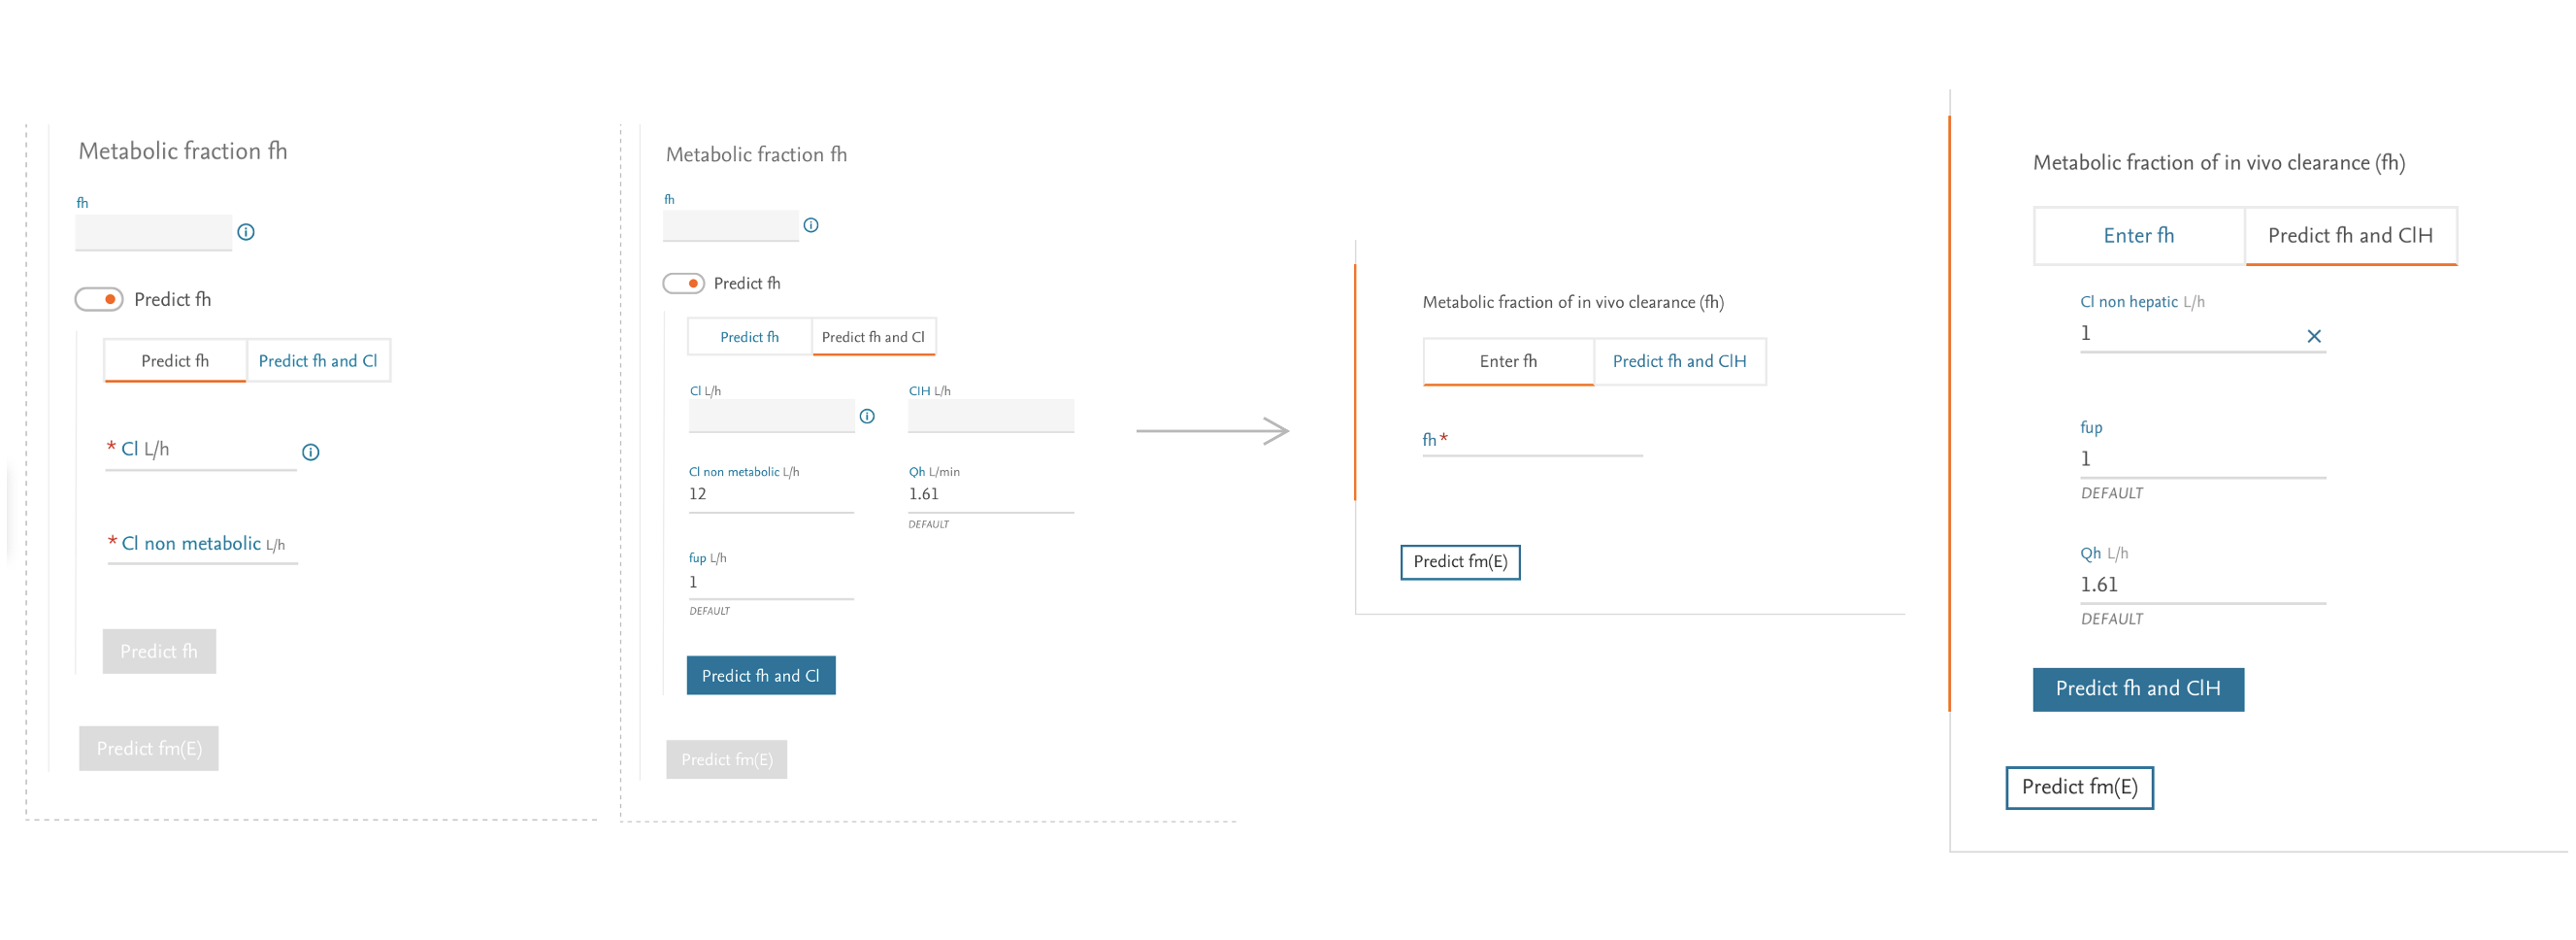
The input form presented our greatest challenge—users needed to enter numerous parameters for multiple drugs while maintaining scientific accuracy.
Design Approach:
- Created a step-by-step wizard breaking the process into manageable chunks
- Implemented progressive disclosure to reduce cognitive load
- Provided clear explanations and tooltips for complex parameters
- Designed intelligent defaults based on common scenarios
- Built transparency into the system by clearly indicating data sources
Collaboration: I defined the core interaction model and flow, while working closely with UI Designer Tina Bota on the visual implementation, ensuring consistency with the broader Elsevier design system.
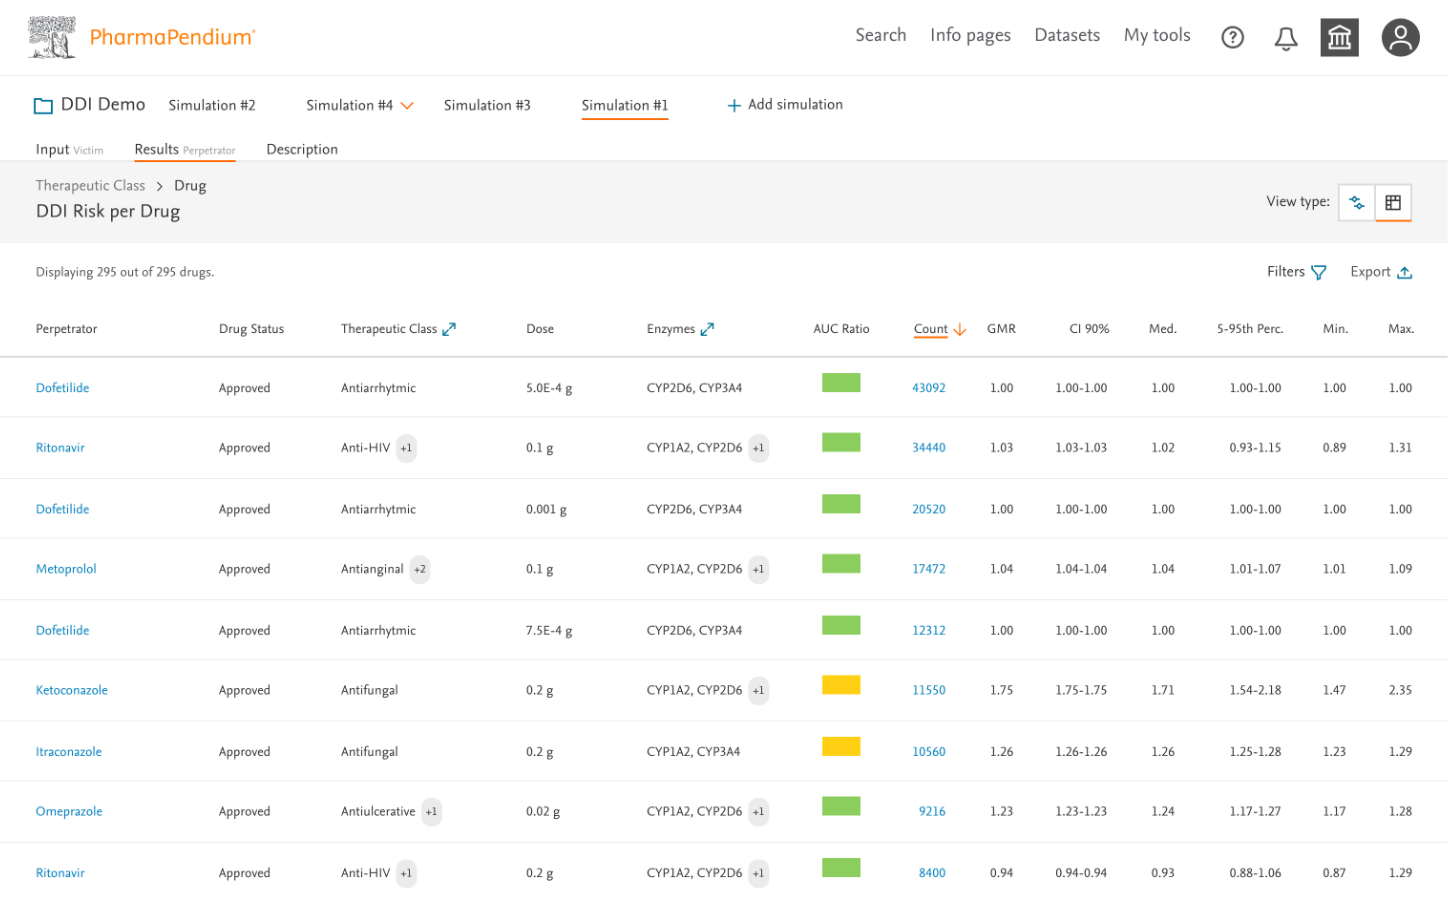
4. Designing for Expert Interpretation
For results visualization, I needed to design for diverse expert users—some requiring quick risk assessments, others needing deep dives into the underlying data.
Design Approach:
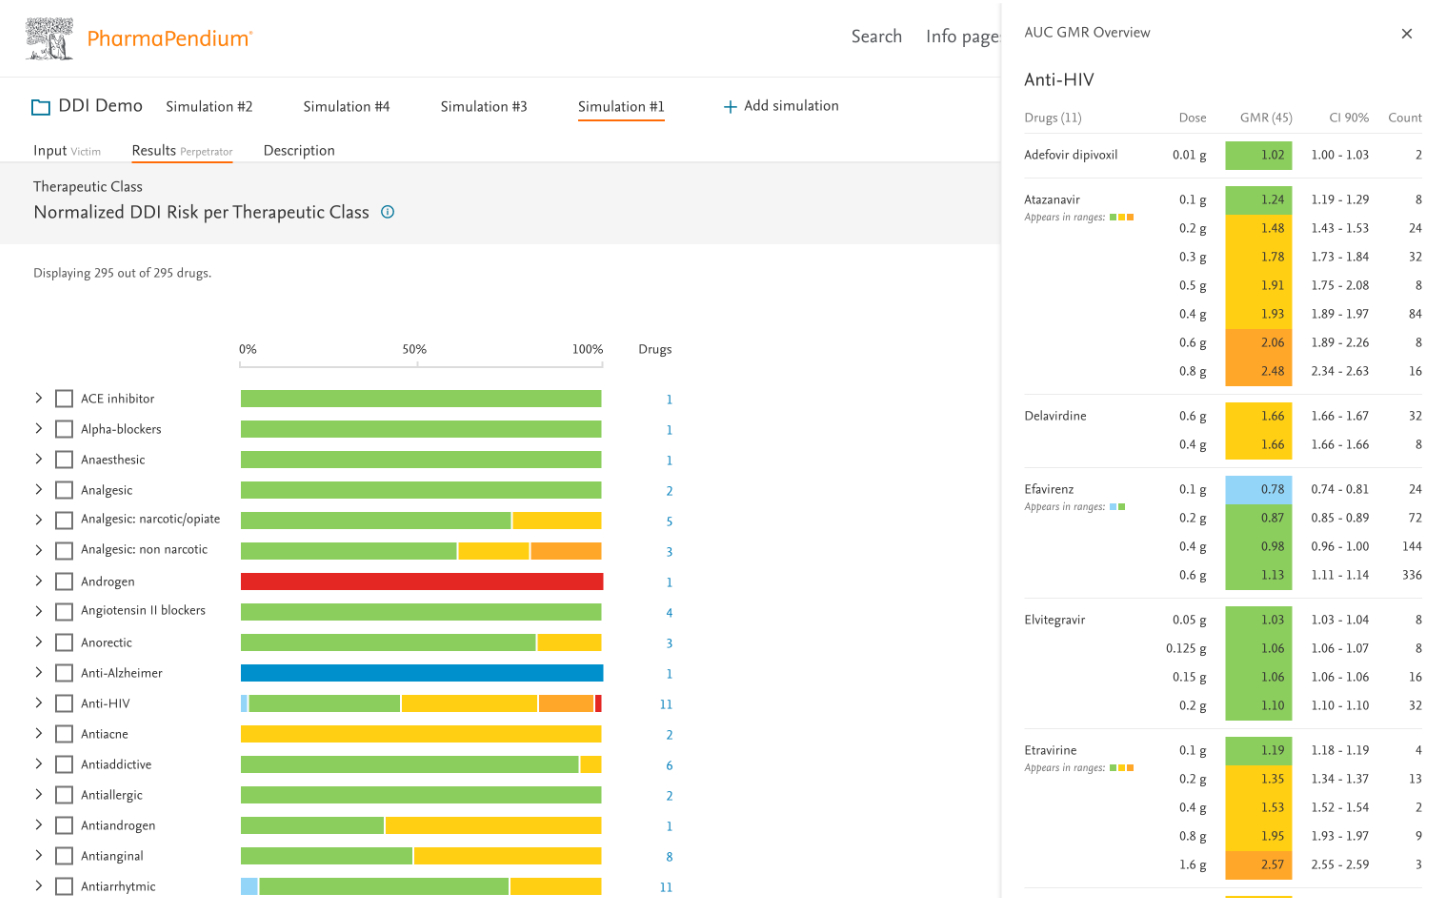
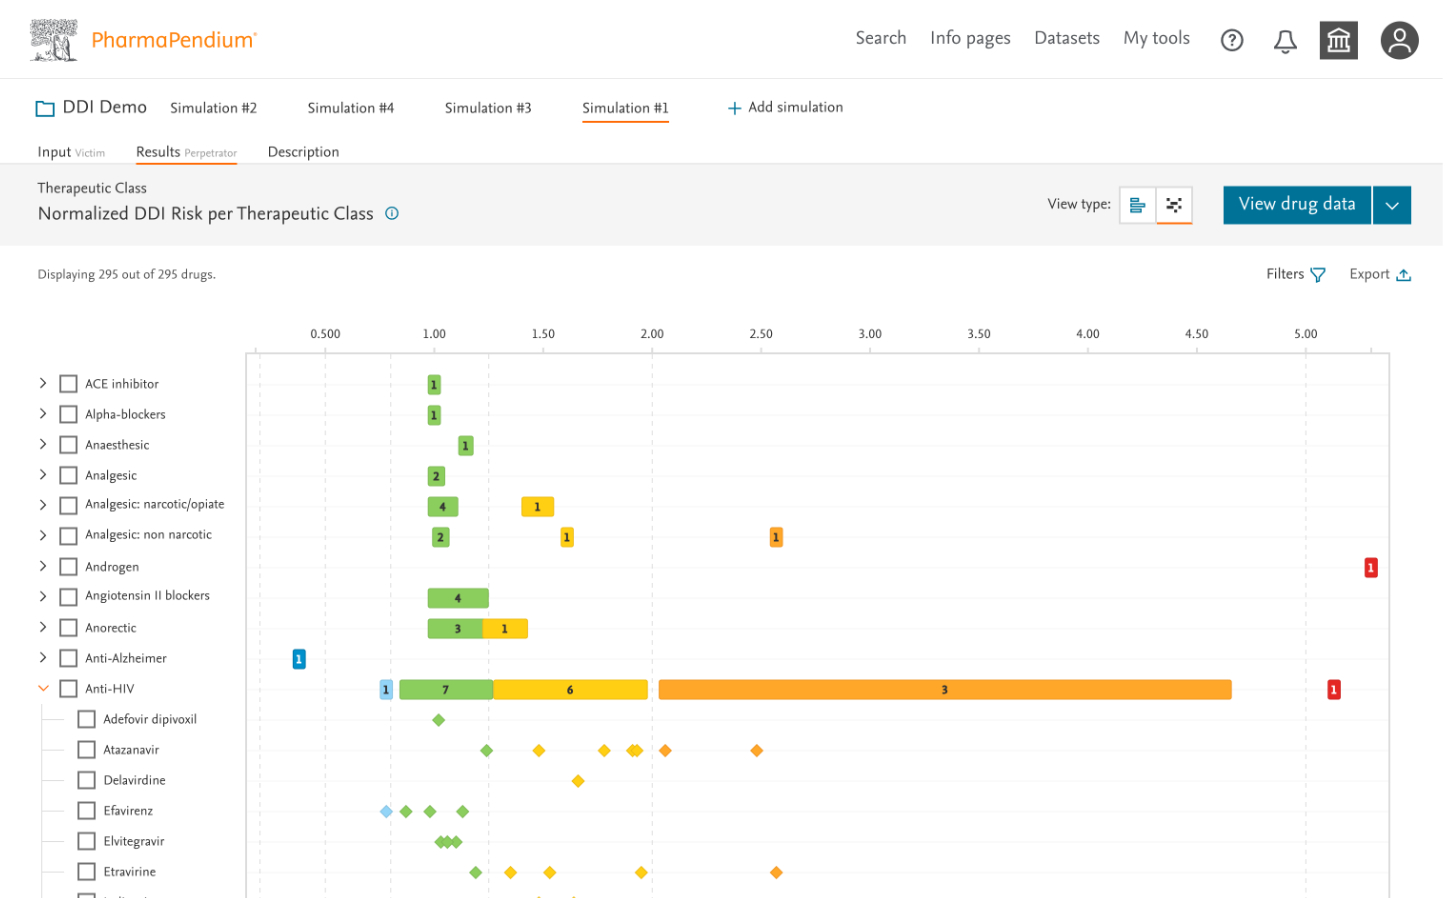
- Created a tiered information architecture showing summary insights before details
- Designed interactive forest plots showing interaction magnitudes with confidence intervals
- Developed sortable, filterable data tables for detailed analysis
- Implemented color-coding to quickly identify high-risk interactions (also checked accessibility and color contrast)
- Added comparison features for evaluating multiple simulations
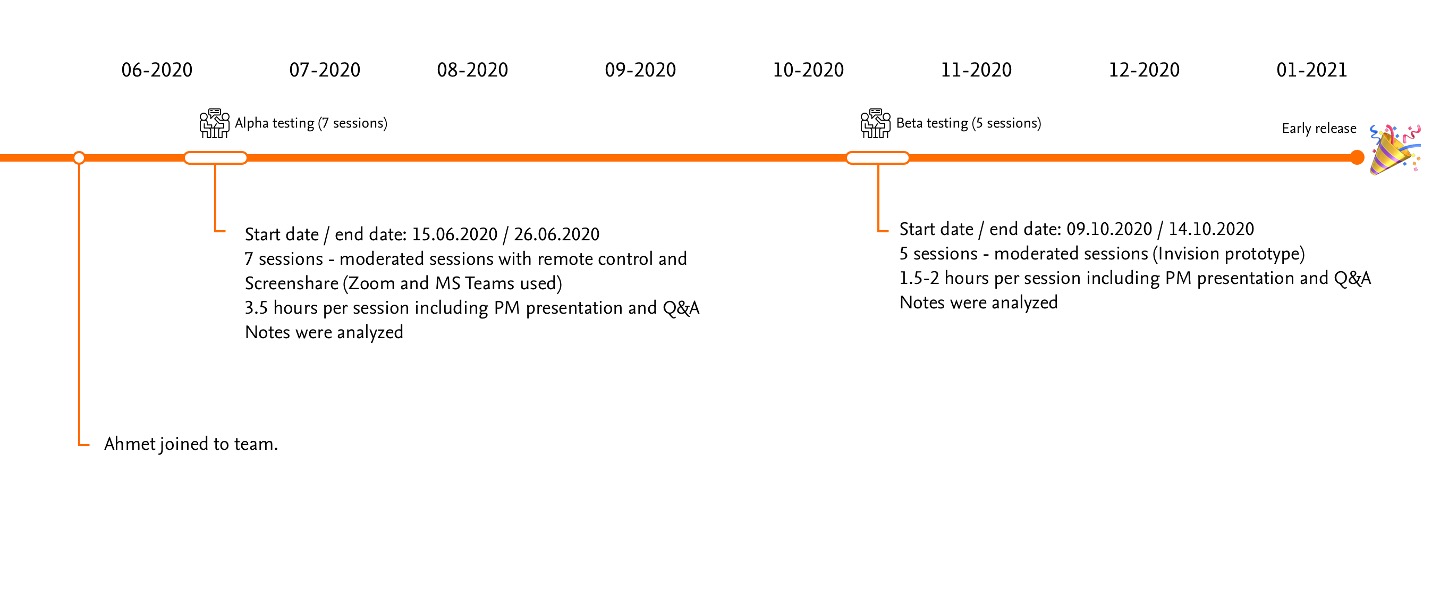
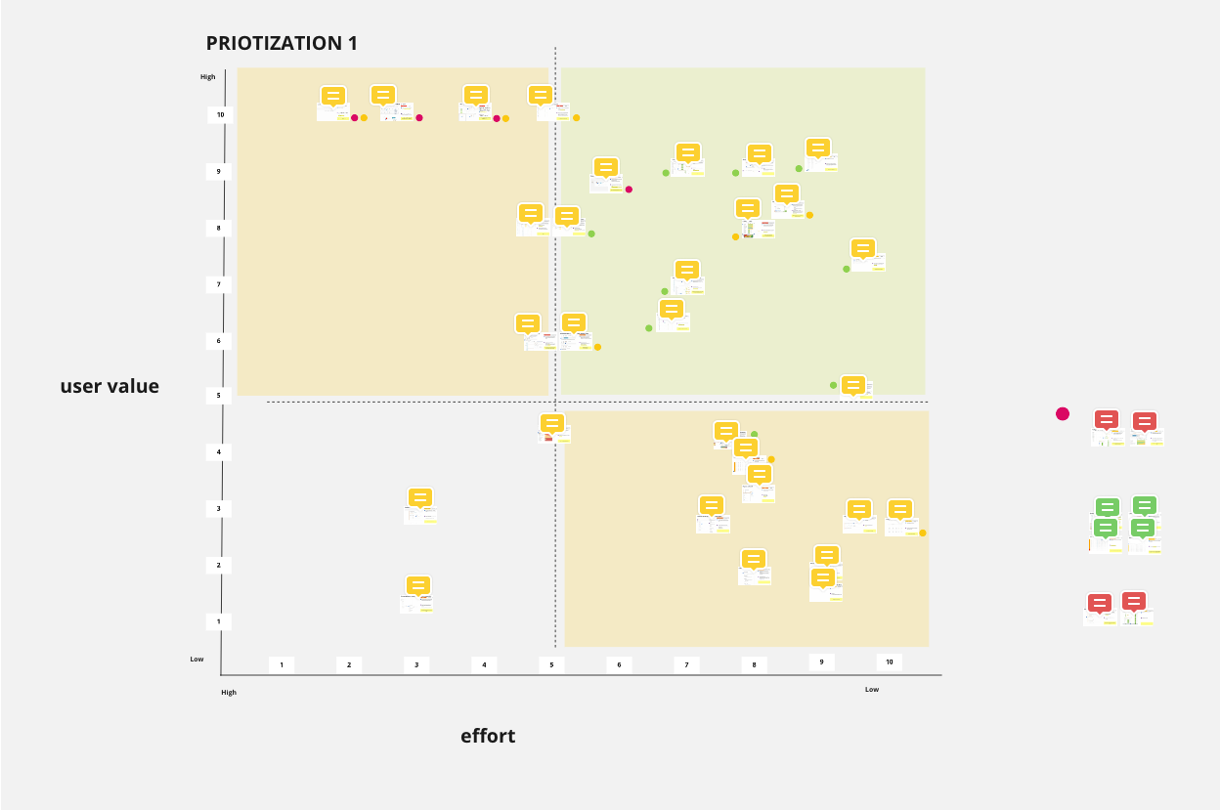
5. Leading User Research
With no dedicated researcher (limited researcher), I planned and executed two critical research phases together with PM's:
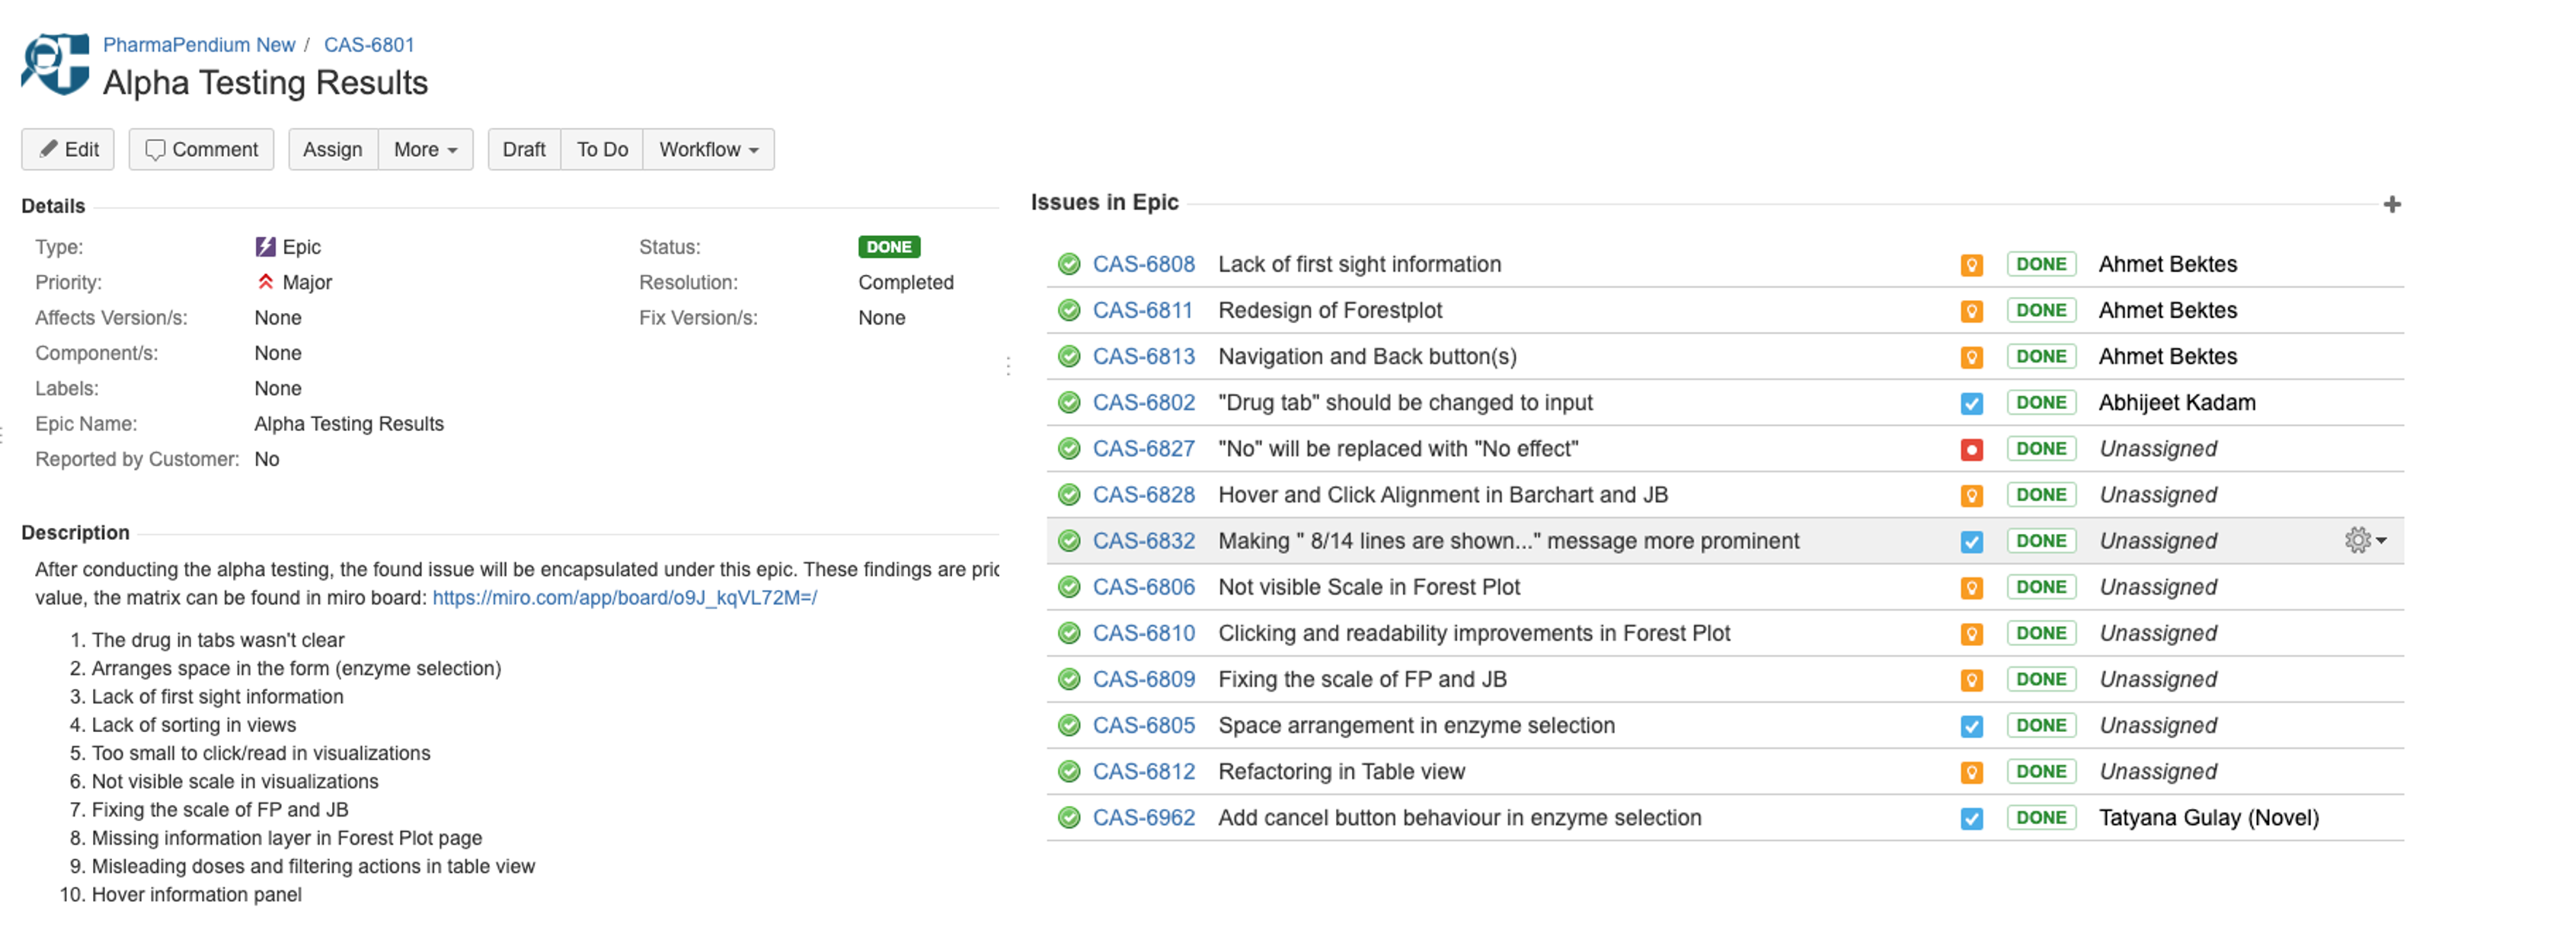
Alpha Testing:
- 12 participants across 4 pharmaceutical partners
- Combination of observational and moderated sessions
- Focus on workflow comprehension and initial usability
Key Findings:
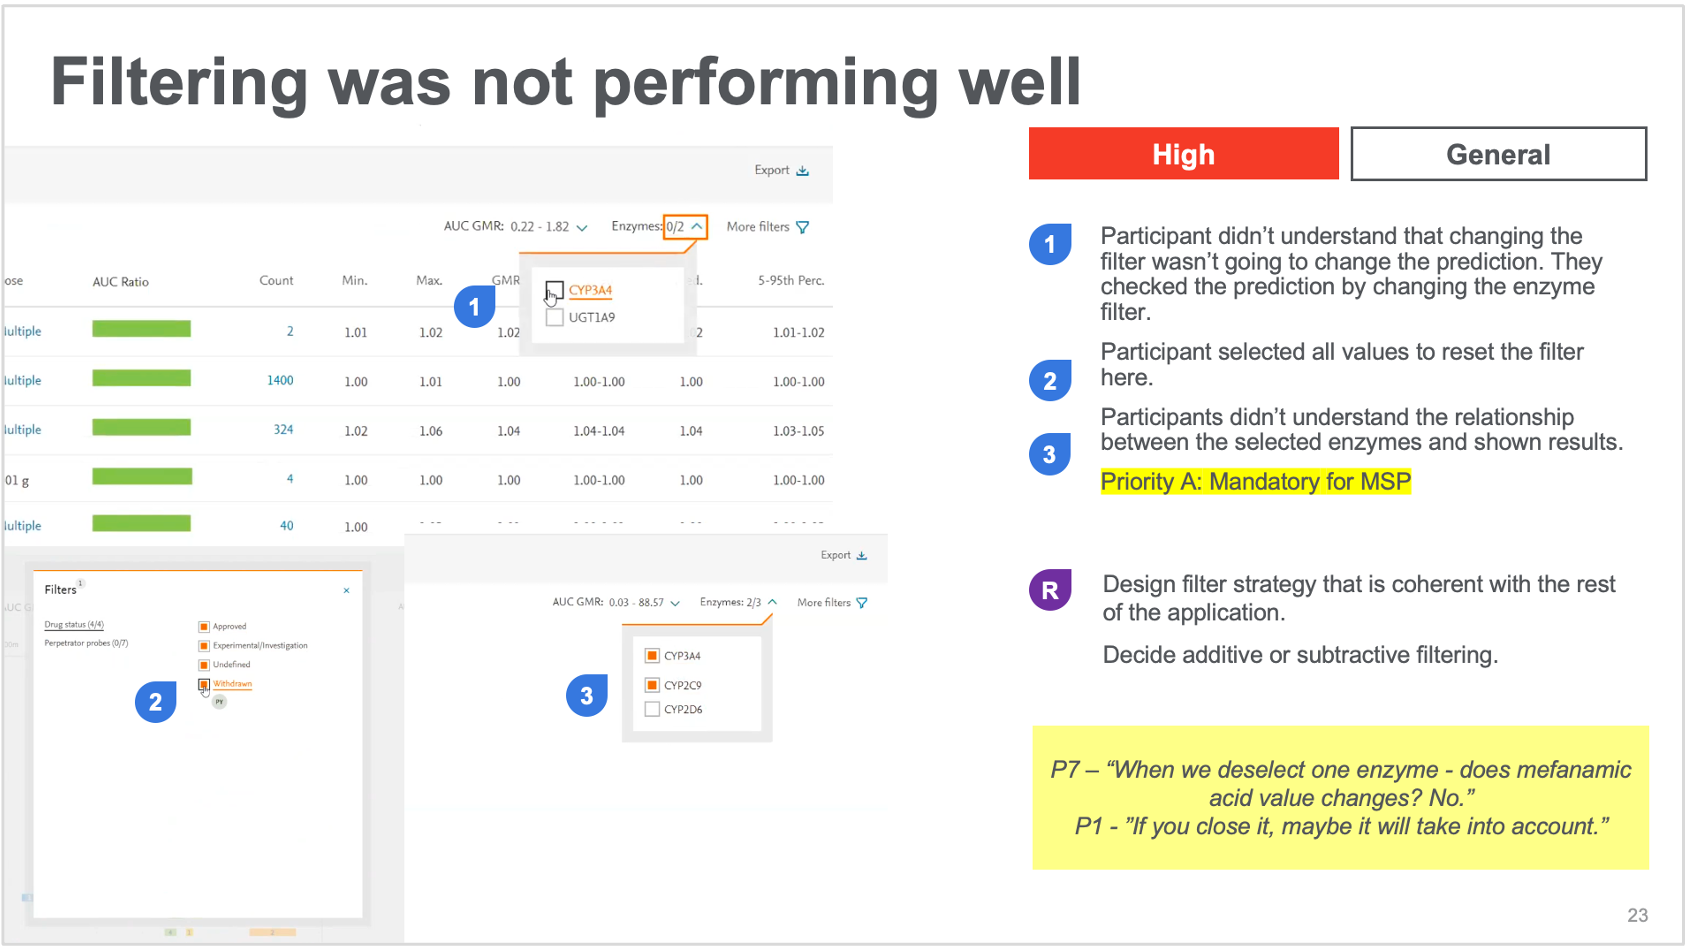
- Users felt overwhelmed by the density of information on results pages
- The wizard flow improved comprehension but needed clearer progress indicators
- Users wanted better explanation of statistical confidence measures
Beta Testing:
- 8 participants focused on specific improvement areas
- Testing refined designs based on Alpha feedback
- Emphasis on visualization preferences and filtering options
Key Findings:
- Forest plots were highly valued but needed better labeling
- Color-coding significance improved scan-ability of results
- Comparison feature was considered essential but needed refinement
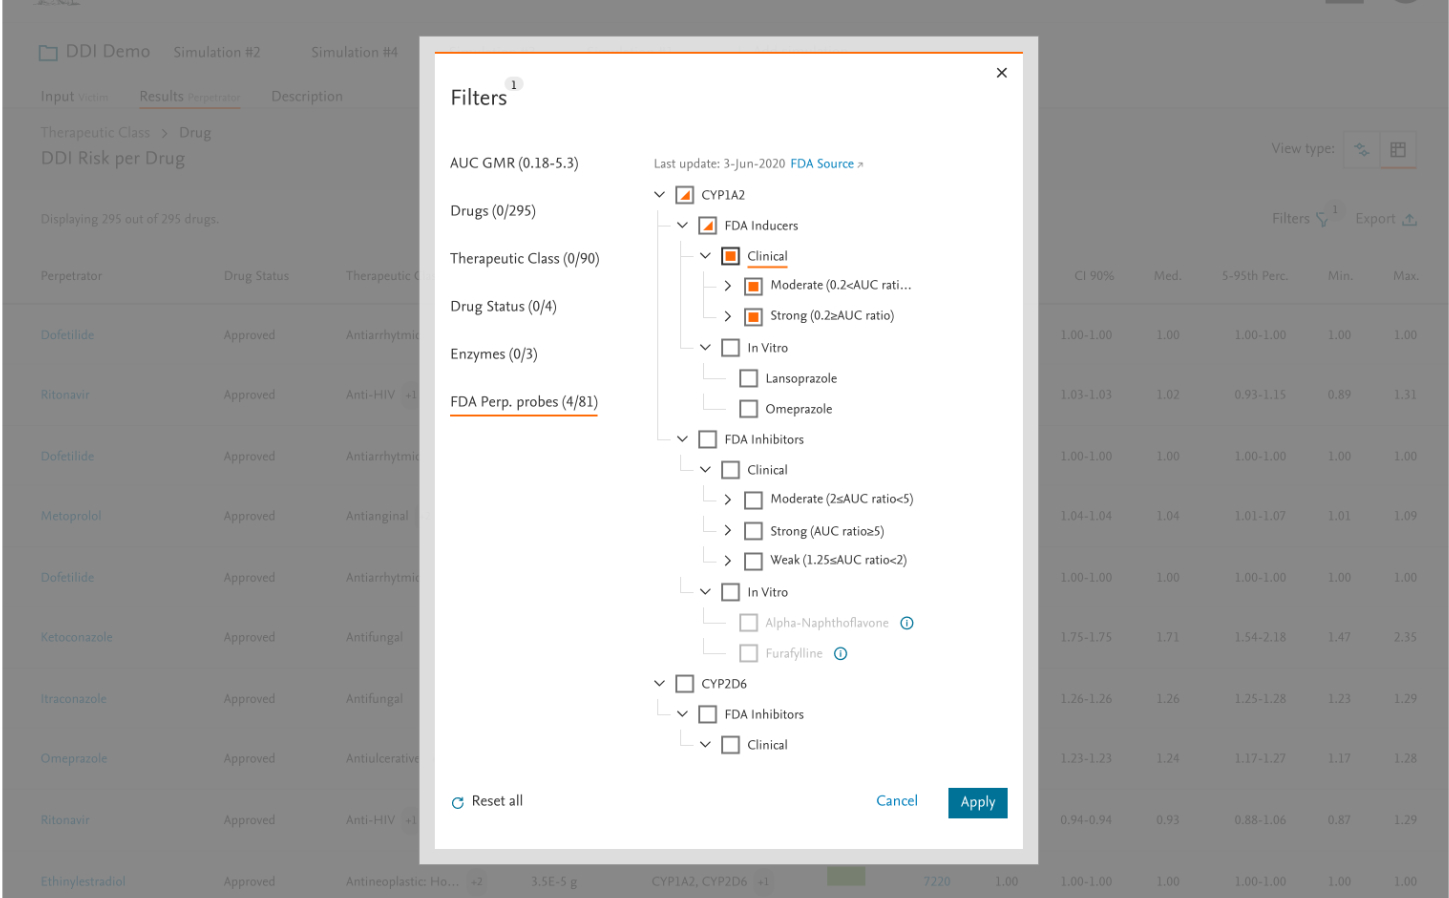
6. Iterative Refinement
Research insights directly informed design improvements:
Key Iterations:
- Redesigned results page with improved information hierarchy (navigation and simulation orders)
- Enhanced color-coding system for interaction severity
- Added customizable filtering options (drug class, target class – requested a lot)
- Improved progress indicators throughout the wizard
- Created enhanced tooltips and explanations for statistical concepts (help side panels and tooltips)
IMPACT & OUTCOMES
DDIRc became a high-value component of the PharmaPendium platform:
User Engagement:
- Scientists ran up to 40-45 simulations per drug development project
- 94% of users rated the tool as “valuable” or “extremely valuable” – improved upselling
- All four pharmaceutical partners renewed their enterprise licenses
Business Impact:
- Increased platform usage after launch
- DDIRc became a key differentiator in sales presentations (beyond content -> tool)
Process Impact:
- Established UX research as a critical component of product development
- Created repeatable templates for testing complex scientific tools (also used safety margin – toxicology navigator (2024,2025)
- Developed a framework for translating scientific requirements into user-centered designs (duplicated in other scientific tools)
REFLECTIONS
Challenges & Learnings:
Leading this project reinforced the value of deep domain knowledge in UX design. While the scientific complexity initially seemed daunting, immersing myself in user workflows and collaborating closely with subject matter experts proved invaluable.
The biggest challenge was balancing scientific accuracy with usability. By focusing on progressive disclosure and contextual guidance, we created a tool that scientists found both trustworthy and efficient.
Taking on dual UX designer/researcher responsibilities stretched my capabilities but ultimately strengthened my practice. The direct connection between research insights and design decisions led to a more cohesive, user-centered product.
What I'd Do Differently:
With additional time and resources, I would have:
- Conducted more iterative testing of individual components before full integration
- Created a more comprehensive onboarding experience for new users
- Developed additional visualization options for different types of interactions
This project demonstrated how thoughtful UX design can transform complex scientific workflows into intuitive digital experiences—helping pharmaceutical researchers make better decisions and ultimately develop safer medications for patients.
Date
2020